Investment Fees Over 30 Years: The Data
In short
- Investing £300 a month for 30 years at 5% growth, yearly charges of 1% leave £40,786 less than no charges: 16.7% of the final pot.
- That's 30% of all the growth. At 2% a year, charges take more than half the growth.
- Only about £24,900 of the £40,786 is charges you'd see deducted. The rest is growth those charges would have earned.
- Time matters more than the amount: the cost of 1% charges grows about 17 times from 10 years to 30.
- The full dataset of 162 scenarios is free to download and reuse with a link to this page.
- Cost of 1% a year on £300 a month over 30 years
- £40,786
- Share of the growth that 1% a year takes over 30 years
- 30%
- Share of the growth that 2% a year takes over 30 years
- 54%
- Scenarios in the free dataset
- 162
On this page
Investment charges are usually quoted as small yearly percentages: 0.25% for a platform, 0.1% for an index fund, perhaps 1% or more for an actively managed fund or an adviser. They’re easy to overlook next to the growth you hope to make. We modelled 162 scenarios to show what those percentages cost in pounds over 10, 20 and 30 years, and how much of your growth they take. The results are below, and the full dataset is free to download.
What do 1% fees cost over 30 years?
Someone invests £300 a month for 30 years, paying in £108,000 in total. Their investments grow at a steady 5% a year before charges. Here is what they end up with at each level of total yearly charges:
| Total charges a year | Value after 30 years | Cost compared with no charges | Share of the pot lost | Share of the growth lost |
|---|---|---|---|---|
| 0% | £244,613 | – | – | – |
| 0.25% | £233,597 | £11,016 | 4.5% | 8.1% |
| 0.5% | £223,148 | £21,465 | 8.8% | 15.7% |
| 1% | £203,827 | £40,786 | 16.7% | 29.9% |
| 1.5% | £186,429 | £58,184 | 23.8% | 42.6% |
| 2% | £170,752 | £73,861 | 30.2% | 54.1% |
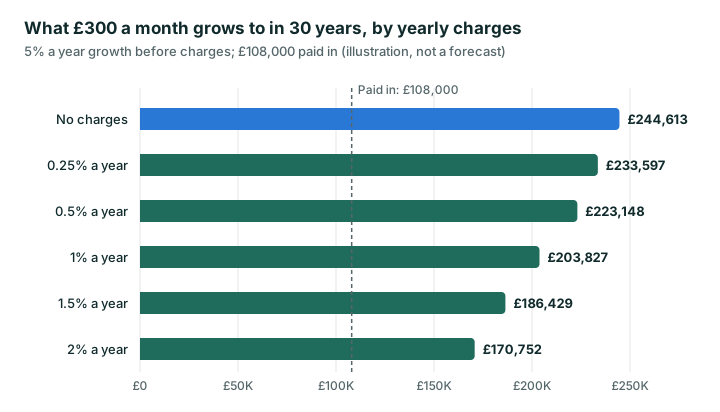
With no charges, £108,000 paid in grows to £244,613, so £136,613 is growth. Charges of 1% a year take £40,786 of that, almost a third. At 2% a year, more than half the growth goes in charges, even though 2% sounds small next to 5%.
The difference between a low-cost and a high-cost setup is large too. Paying 0.25% a year instead of 1% leaves £29,770 more after 30 years in this example.
Why the cost is bigger than the charges you see
Percentage charges are taken from your whole balance, every year, whether your investments rise or fall. That has two effects. The charges themselves grow as your balance grows, and every pound taken in charges also loses all the growth it would have earned in later years.
In the 1% example, the charges actually deducted over 30 years add up to about £24,900. The other £15,900 of the £40,786 total is growth that money would have earned if it had stayed invested. That’s why we measure cost as the difference between the final value with charges and the final value without them, not the sum of the charges.
How does the cost change over time?
Time has a much bigger effect than the amount you invest. This table shows the cost of 1% a year in charges, at 5% growth before charges, for different monthly amounts and lengths of time:
| Monthly investment | 10 years | 20 years | 30 years |
|---|---|---|---|
| £100 | £804 | £4,392 | £13,595 |
| £300 | £2,412 | £13,177 | £40,786 |
| £500 | £4,020 | £21,962 | £67,976 |
Investing three times as much costs three times as much in charges, because the charges are a fixed percentage. But tripling the time from 10 to 30 years multiplies the cost by about 17. Over 10 years, 1% a year takes 5.2% of the final pot; over 20 years, 10.8%; over 30 years, 16.7%.
That’s why charges matter most for long-term money, such as a pension or a Junior ISA, where the investments may stay invested for decades.
Does the growth rate change the result?
We repeated the study at 3%, 5% and 7% a year growth before charges. For £300 a month over 30 years with 1% charges:
| Growth a year before charges | Cost of 1% charges | Share of the pot lost | Share of the growth lost |
|---|---|---|---|
| 3% | £26,945 | 15.5% | 41.1% |
| 5% | £40,786 | 16.7% | 29.9% |
| 7% | £62,147 | 17.7% | 25.6% |
The cost in pounds rises with growth, because charges are taken from a bigger balance. Over 30 years, the share of the final pot lost stays between about 15% and 18% whatever the growth rate. The share of the growth lost is highest when returns are low: at 3% a year, 1% charges take two-fifths of the growth. The charge rate stays the same, but returns don’t, so in years when markets fall you still pay it.
What do UK investors typically pay?
Charges vary widely, and they come in layers. You might pay:
- a platform fee, either a percentage of your balance or a flat amount
- fund charges (the ongoing charges figure) inside each fund or ETF
- dealing charges when you buy and sell shares, ETFs or investment trusts
- an adviser’s fee, if you use one
An index fund held on a low-cost platform can come to well under 0.5% a year in total. Actively managed funds, ready-made portfolios and advised arrangements can push the total to 1% or more. For comparison, the rules cap most charges paid by members (excluding transaction costs) at 0.75% a year in the default funds of workplace pensions used for automatic enrolment.
The FCA expects platforms to show their costs and charges clearly, and to give the total cost in pounds as well as a percentage before you invest, so you can add the layers up. Our platform fees guide explains each charge and how flat and percentage fees compare.
What this means if you’re investing
- Add up all the charges, not just the platform fee or the fund fee. The study uses total yearly charges.
- Compare in pounds for your own balance and time frame. In our 30-year example, paying 0.5% a year rather than 1% made a difference of over £19,000.
- Higher charges need higher returns to pay for themselves. A fund charging 1% more a year has to beat a cheaper alternative by about that much a year, on average, just to match it.
- Don’t choose on cost alone. The cheapest option isn’t automatically the right one, but you should know what you’re paying for.
You can test your own figures in our compound interest calculator, which shows the cost of fees, or compare yearly platform costs with the platform fee calculator.
Methodology
We modelled every combination of:
- Monthly investment: £100, £300 and £500, with no starting lump sum
- Time: 10, 20 and 30 years
- Growth before charges: 3%, 5% and 7% a year
- Total yearly charges: 0%, 0.25%, 0.5%, 1%, 1.5% and 2%
That’s 162 scenarios. Each uses the same month-by-month model as our calculators. Annual growth and annual charges are converted to equivalent monthly rates, so 5% growth compounds to exactly 5% over a year and 1% charges take exactly 1% a year from money that stays invested for the full year. Contributions are added at the end of each month. Charges are taken as a percentage of the balance, which is how most UK platform and fund charges work.
“Cost compared with no charges” is the final value with no charges minus the final value with charges. “Share of the pot lost” divides that cost by the final value with no charges. “Share of the growth lost” divides it by the growth with no charges (final value minus total paid in).
The model leaves some things out on purpose:
- Steady growth. Real investments rise and fall, sometimes sharply. The growth rates are assumptions for illustration, not forecasts.
- No tax. The figures assume a tax-free account such as an ISA or pension.
- No inflation. All figures are in future pounds, not today’s money.
- Percentage charges only. Flat platform fees, dealing charges and currency costs aren’t included, because they depend on how you invest.
Download the data
The full dataset (CSV) has one row for each of the 162 scenarios, with the amount paid in, the final value, the cost compared with no charges, and both percentage measures. You’re free to use these figures, the tables and the chart in articles, research or teaching, as long as you credit Investing Desk and link to this page.
To cite this analysis: Investing Desk, “Investment Fees Over 30 Years: The Data”, October 2026, investingdesk.co.uk/investment-platforms/investment-fees-over-30-years/.
We’ll re-run the study if our model changes, and note any update on this page.
Sources
- FCA: Investment platforms costs and charges review – good and poor practice
- FCA Handbook COBS 19.6: charge cap for workplace personal pensions
- The Occupational Pension Schemes (Charges and Governance) Regulations 2015
- MoneyHelper: Investing for beginners
Our guides are general information and education, not personal financial advice. If you are unsure whether an investment is right for you, speak to a regulated financial adviser. Capital at risk. Investments can fall as well as rise, and you may get back less than you put in.